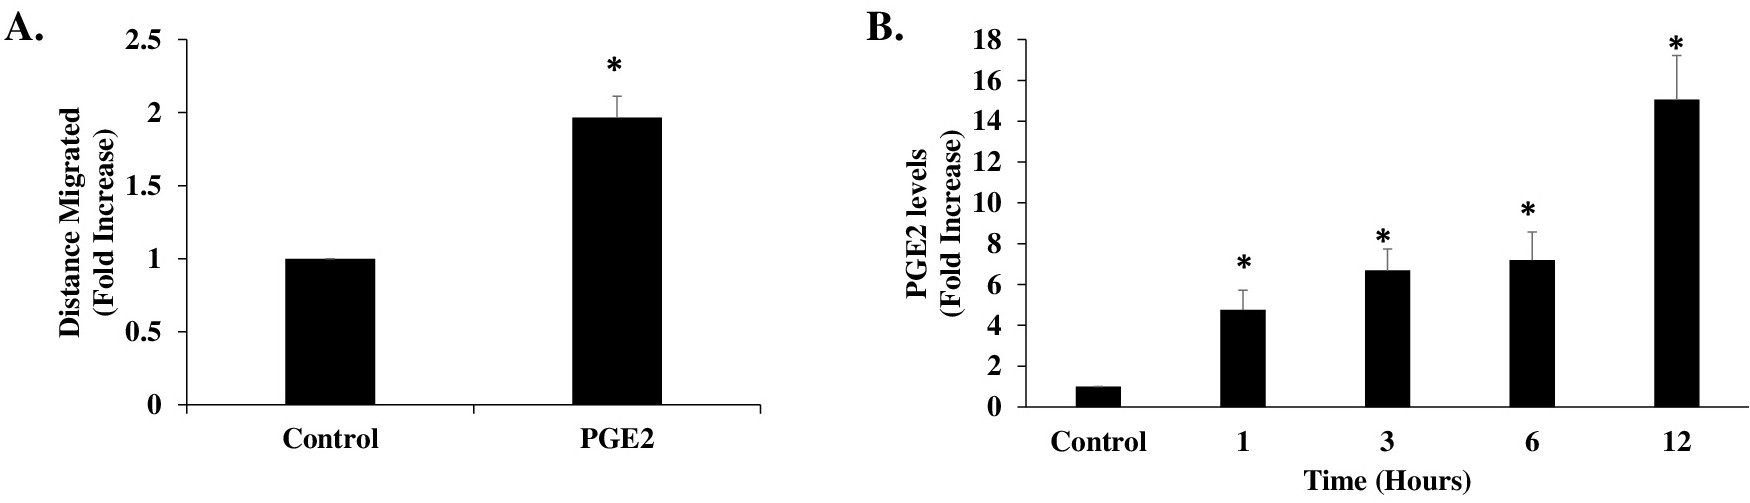
Fig. 9. PGE2 enhances migration and its levels are increased in response to Cd. (A): Cells were treated with 1 µM PGE2 for 12 hours and migration was assessed by scratch assay. (B): Cells were treated with Cd (100 nM) for 1, 3, 6 and 12 hours and PGE2 production was assessed using ELISA kit. Values are represented as the mean of fold increase ± SEM of three independent experiments. * denotes p<0.05.